Link :


Gold ETF Surge Sends Price Just 1% off $4000 with Fastest Jump Since the 1970s


The GOLD PRICE surged to fresh all-time highs barely 1% off $4000 per ounce on Monday, lifting its year-to-date gain past 50% − the strongest annual rise outside the 1970s' oil crises − as political turmoil in the US, Japan and France continued amid strong investment inflows to gold-backed ETF trust funds, writes Atsuko Whitehouse at BullionVault.

Spot gold priced in US Dollars surged as much as 1.8% to an all-time high of $3958 per ounce, while wholesale bullion for UK and European investors earlier jumped as much as 2.0% and 2.5% to highs of £2942 and €3387 respectively.

Gold in Japanese Yen climbed 3.5% to a new spot-market record of ¥19,078 per gram, pushing the retail price including consumption tax above ¥21,000 for the first time.

Today's surge followed gold's 5th consecutive weekend record in a row, and set the 41st new daily high this year.

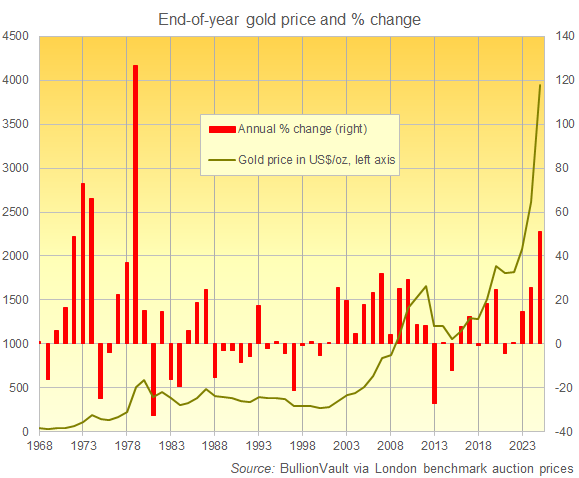
The 'safe haven' yellow metal is currently showing a year-to-date gain of more than 50%, the biggest annual rise since the 1979 oil shock.

Price of gold in US Dollars plus year-end % change. Source: BullionVault

"Gold rallies can continue into 2026 aided by official sector buying," says bullion-bank and ETF storage provider HSBC in a note.

"Institutional demand for gold as a [portfolio] diversifier can stay robust" too, it adds.

With gold prices approaching $4000, London bullion clearer UBS has raised its gold and silver price forecasts to $4200 per ounce and $55 per ounce by mid-2026, with the Swiss bank's strategists saying the revisions reflect expectations of stronger central bank and ETF demand.

US investment bank Goldman Sachs has already predicted that gold would soar to nearly $5000 per ounce if just 1% of privately-held US Treasury holdings go into gold, saying the move would be exacerbated if investment flows into gold ETFs continue to jump.

Total gold ETF holdings worldwide stood above 3,806 tonnes as of 26th September, according to data from the mining industry's World Gold Council data, worth a record  $461.5 billion but still 3.1% below the peak by weight hit at the height of the Covid crisis in November 2020.

The divided US Senate will vote Monday on a stopgap bill to reopen the government through 21st November, after shutdowns since 1st October delayed key economic data, including Friday's non-farm payrolls and derivatives regulator the CFTC's weekly gold and other commodity positioning reports.

"I think that if the President decides that the negotiations are absolutely going nowhere that there will start to be layoffs," said Kevin Hassett, Trump's top economic adviser in the White House, on Sunday.

Japan's ruling party meantime selected fiscal and monetary 'dove' Sanae Takaichi as the LDP's new leader, setting her on course to become the country's first female prime minister later this month.

Japanese stock markets today surged over 5.0% to a record high, while the Yen fell past ¥150 per US Dollar, and 30-year government bond yields hit a historic peak amid worsening fiscal concerns.

France is also due a new prime minister after Sébastien Lecornu resigned less than a month after being appointed, spurring a 2.0% plunge in Paris' Cac 40 stock index and pushing up the spread of France's 10-year borrowing costs over German Bunds to 0.88 points − its highest since the Eurozone debt crisis more than a decade ago.

With gold jumping on the latest ETF inflows, prices for silver − which finds nearly 60% of its annual demand from industrial uses − rose as much as 1.6% to $48.75 per ounce in earlier trading on Monday, barely $1 off the all-time high of $50 hit in 1980 and 2011.

The grey metal has now risen 67.9% year-to-date.

Israel and Hamas were meanwhile set to begin mediated negotiations in Egypt on Monday after US President Trump gave the Gaza political and military group a Sunday deadline to accept his peace plan or face "all hell".

Gold rates during the last seven days

Gold Coin Prices


Prices at close on
October 16, 2014
Spot gold price:
$1,238.66
Spot silver price:
$17.38

ok ok ok width="75" ok ok
Austrian
Philharmonic
American
Eagle
Canadian
Maple Leaf
So. African
Krugerrand
American
Buffalo
Australian
Kangaroo
Click on image for full photo + specifications
 
Closing* gold bullion coin prices
(one ounce)
$1,291.92
$1,297.50
$1,282.01
$1,291.92
$1,298.74
$1,312.98
Closing gold bullion bar prices
1 oz. gold bar $ 1,278.92
10 oz. gold bar $ 12,758.20
Kilo bar (32.15 oz.) $ 40,559.64
We encourage you to compare our prices to those of firms with high profile national media campaigns.
Volume discounts available. Please call.
*Closing price = FOREX price 3pm Mountain Time.


Live gold coin prices
(one ounce)
12:18 pm Fri. October 17, 2014
Current gold spot price
$1239.22
American Eagle $1,298.08
American Buffalo $1,299.32
South African Krugerrand $1,292.51
Canadian Maple Leaf $1,282.59
Austrian Philharmonic $1,292.51
American Eagle Proof $
Volume discounts available. Please call.
Refresh
 
Gold Trading Hours
London • New York • Sydney • Hong Kong • Zurich
 
United States $20 gold piece closing prices
(.9675 fine ounces)

$1,529.09
$20 Liberty, UNC
$1,523.55
$20 St. Gaudens, UNC
$1,551.25
$20 Liberty Mint State 62
$1,811.63
$20 Liberty Mint State 63
$1,988.92
$20 Liberty Mint State 64
$1,595.57
$20 St. Gaudens Mint State 63
$1,673.13
$20 St. Gaudens Mint State 64
$2,011.08
$20 St. Gaudens Mint State 65

Please call for current quotes on US $20 gold pieces

We encourage you to compare our prices to those of firms with high profile national media campaigns.
Volume discounts available. Please call.

 
Closing fractional gold coin prices
Half-ounce gold coins**
Quarter-ounce gold coins**
American Gold Eagle $662.68
Maple Leaf $665.78
Philharmonic $668.88
American Gold Eagle $337.53
Maple Leaf $340.63
Philharmonic $342.18
Tenth-ounce gold coins**
American Gold Eagle $139.97
Maple Leaf $141.21
Philharmonic $141.21

Gold Price Annual End of Period

Gold Price Annual End of Period

Year
1999
2000
2001
2002
2003
2004
2005
2006
2007
2008
2009
2010
2011
2012
2013
2014
USDEURGBP
290.2289.6180.1
274.5292.3183.7
276.5310.5189.9
347.2330.9215.7
416.3330.0232.5
435.6320.5226.9
513434.9298.8
632479.3322.9
833.8570.3418.8
869.8625.7604.9
1087.5757.9673.4
1405.51047.7897.7
15311179.4985.1
1657.51257.21019.7
1204.5871.9728.9
1238.9969.8769.7
JPYCHFCAD
29708.5464.6421.2
31342.2444.7412.2
36238.1459.1441.4
41202.2480.1548.5
44609.5514.8537.9
44635.9495.3521.9
60549.4676.1599.3
75305.9771.5735.5
93142.4943.9822.9
78842.8925.71073.7
101240.81124.21140.1
113993.11310.11396.6
117795.11431.61558.9
143315.71517.21650.4
126514.61067.71284.2
132142.31171.31394.6
AUDCNYINR
443.52403.112630.9
493.92271.712811.3
540.12288.513332.8
616.62873.816648.2
552.53445.218991.4
555.73605.218935.5
699.3414023090.1
801.84932.827972.3
949.586089.832862.3
1247.55934.342374.2
1209.27424.47424.4
1371.29261.862846.9
1493.49636.181303.7
1596.510326.790814.4
1351.87301.474624.8
1413.37587.476142.8

What is the gold ?

Gold is the most popular precious metal accepted by everyone. It is a soft, dense, malleable and ductile metal with a bright yellow color, and its lustre is maintained without tarnishing in water or air. Its chemical symbol is Au. Gold is one of the least reactive chemical elements, keeping solid state under standard conditions. Throughout history, gold has been sought after by people, used as money and made into jewelry. Nowadays, more and more people are glad to hold gold that is not only used for gorgeous jewelry, or used in industry, but more commonly trading as a popular investment product.

How many types of gold investment products?

Of all the precious metals used as an investment product, gold is the most popular. Generally, investors buy gold investment products as a way of diversifying risk. Gold investments are held and declared in different forms, such as gold bullions, gold ETFs, gold options and futures, and so on. Different investment types carry different investment risks. However, no matter what type of gold investment is held, it is critically important for investors to keep an eye on the gold price.

What factors influence the price of gold?

Throughout history, the price of gold has varied but has always continued to rise. In very recent times, from 2011 to the end of 2013, the fluctuations in gold prices have been dramatic. Fluctuations in the price of gold are driven by supply and demand including demand through speculation. The price is also affected by the policy of central banks and the International Monetary Fund, the value of the US dollar, the state of the global economy, by war, by invasion and by national emergency.

What are the international major gold markets?

In order to establish rules designed to prevent market manipulation, abusive trade practices and fraud, the global gold markets are overseen and regulated by governmental and self-regulating organizations. Globally, there are four important international gold exchange markets, they are London Gold Market (London Bullion Market Association, abbreviated as LBMA), America Gold Market (CME Group), Zurich Gold Market (controlled by three banks - UBS, Credit Suisse and Union Bank of Switzerland) and Hong Kong Gold Market (Chinese Gold and Silver Exchange Society, abbreviated as CGSE). The Japanese gold market (Tokyo Commodity Exchange, abbreviated as TOCOM) is also important. By linking these markets, gold trading can be achieved within 24 hours of continuous trading in the worldwide network.
The London gold market is by far the largest global centre of OTC transactions. Its gold spot-price is fixed twice each business day at 10:30 am and 3:00 pm (London time) in USD, GBP, and EUR. London prices have a great influence on the world gold market price.

Which is the largest gold producing country?

Before 2006, South Africa was the world's dominant gold producer, followed by the United States of America, China, Australia, and Peru. More recently, other countries with greater land surface areas have surpassed South Africa. Since 2007, China has become the largest gold producing country, followed by Australia, United States, Russia, and Peru. South Africa sits in sixth position.

What is the use of gold?

According to GFMS as of 2012, a total of 174,100 tonnes of gold has been mined in human history. Currently, the world consumption of gold produced is about 50% in jewellery, 40% in investments, and 10% in industry. In industry, gold is commonly used in electronics, dentistry, commercial chemistry and other fields. Its characteristic of high malleability, ductility, resistance to corrosion and most chemical reactions, and conductivity of electricity have led to many more uses, including colored-glass production, electric wiring, and gold leafing.

Traders See More Losses for Gold ETF as Dollar Rallies

Gold is losing its luster in the options market.
The metal has tumbled 13 percent since mid-March and traders are increasing bets that further declines are coming. The cost of puts on the SPDR Gold Trust (GLD) has reached the highest level in nine months relative to calls, while a measure of the exchange-traded fund’s volatility surged almost 50 percent last month.
Faster economic growth and speculation the Federal Reserve will tighten monetary policy has propelled the dollar to a four-year high and hurt demand for gold, often used as a hedge against inflation. Hedge funds and other speculators have pared bets on rising gold prices for the past seven weeks, the longest stretch since 2010. Goldman Sachs Group Inc., Societe Generale SA and HSBC Securities (USA) say they expect lower prices.
“There’s no point in buying gold,” John Stephenson, chief executive officer at Stephenson & Co. Capital Management in Toronto, said in a phone interview. The firm manages about C$45 million ($40 million). “You’ve got gold looking weaker because the U.S. dollar looks stronger, and that’s the first and most important factor.”
The $30 billion gold ETF, the biggest fund tracking bullion prices, sank 6.2 percent last month, the most since June 2013. For the year, it’s down 0.1 percent after soaring 15 percent to a high in March.
Put contracts betting on losses in the shares cost 3.9 points more than call options wagering on a rise, according to three-month data compiled by Bloomberg. The spread, known as skew, increased to 4.4 points on Oct. 3, the widest since Dec. 24.

Receding Risk

“Declining gold prices reflect strength in the dollar,” Mark Luschini, chief investment strategist at Philadelphia-based Janney Montgomery Scott LLC, which oversees $67 billion in assets, said by phone. “Gold prices falling is indicative of receding macroeconomic risk, strength in the U.S. economy and a move by the Fed to less accommodative monetary policy.”
Demand for precious metals as a protection of wealth has been eroded by the outlook for a strengthening U.S. economy, which helped spark a rally in the dollar. The Bloomberg Dollar Spot Index has climbed for seven straight weeks and reached a four-year high on Oct. 3, strengthening versus all 16 of its most-traded peers in that period. The gauge dropped 0.9 percent yesterday, helping gold futures rebound 1.2 percent.
Speculation that the Fed will raise interest rates next year has also crimped demand for the metal as a hedge against U.S. inflation, as central banks in Europe and Japan pursue looser monetary policies. Gold fell the most in more than two months Oct. 3 as a report showed the U.S. jobless rate declined to a six-year low of 5.9 percent in September and employers added more workers than projected.

‘Faster Pace’

On Oct. 2, Goldman Sachs reiterated its forecast for prices to reach $1,050 an ounce in 12 months and HSBC cut its outlook for 2015 to $1,175 from $1,310. Recent economic expansion means the market will “start pricing a much faster pace of” increases for U.S. interest rates, Societe Generale said in a report Oct. 3, saying the metal will trade “well below $1,200.”
About $4 billion was erased from the value of exchange-traded products backed by gold this year through Oct. 3. Individuals pulled more than $986 million from the SPDR Gold ETF last month, the most since April, data compiled by Bloomberg show.

Long, Short

Hedge funds boosted net-short positions in New York bullion futures and options to the highest level on record in the week ended Sept. 30, U.S. Commodity Futures Trading Commission data show.
Net-long positions in gold fell to the lowest since December that week, a sign that a short squeeze could occur, according to Michael Purves, chief global strategist and head of equity derivatives research at Weeden & Co. in Greenwich, Connecticut. A so-called short squeeze occurs when prices rise as investors who made bearish bets are forced to buy the security to pay back borrowed shares.
When long-gold positions dropped to a six-year low in December, gold rebounded more than 10 percent in January and February after touching $1,182.57 intraday Dec. 31.
“For bears to decisively take out the intraday low from Dec. 31, they will likely need to see the dollar continue to rally aggressively, particularly given how aggressive the speculative positioning in gold futures has become,” Purves wrote in an e-mail yesterday. “Last Friday’s CFTC data showed net speculative positions at the same low levels reached in June and December of 2013, both of which preceded significant gold relief rallies.”

‘No Yield’

The Chicago Board Options Exchange’s Gold ETF Volatility Index, derived from options prices on the SPDR gold fund, jumped 47 percent in September for its biggest gain in 17 months. It has fallen 6.5 percent since. The CBOE Volatility Index, the gauge of Standard & Poor’s 500 Index options prices known as the VIX, rose 6.3 percent to 15.46 yesterday.
“Gold is going to continue to be weak as the dollar is strong,” Walter “Bucky” Hellwig, who helps manage $17 billion at BB&T Wealth Management in Birmingham, Alabama, said by phone. “You have an increasing interest-rate differential between the U.S. and Europe. If the dollar is appreciating, you’re going to come out of gold, with no yield, into the currency.”
To contact the reporters on this story: Callie Bost in New York at cbost2@bloomberg.net; Eric Lam in Toronto at elam87@bloomberg.net
To contact the editors responsible for this story: Lynn Thomasson at lthomasson@bloomberg.net Jeff Sutherland
 
 
Source : http://www.bloomberg.com

Canada’s Commodity Rally at End as S&P/TSX Plummets

The market-leading rally in metals and energy stocks that pushed Canadian equities to the second-best in the world through much of this year is now a distant memory.
The benchmark Standard & Poor’s/TSX Composite Index has plummeted 7.7 percent from its all-time high on Sept. 3, approaching a 10 percent correction as prices for commodities from crude to copper and gold have plunged in the past three months amid slowing global growth and a rising U.S. dollar.
The S&P/TSX, which peaked at a 15 percent gain for the year in September, good for the second-best performer among developed markets in the world at the time, is now fourth.
“It’s downright ugly,” said John Kinsey, a fund manager at Caldwell Securities Ltd. in Toronto. His firm manages about C$1 billion ($893 million). “It’s the commodity stocks, but the main culprit is energy. It’s really being whacked here. People are thinking maybe they want to walk away from the oil patch.”
Energy and materials stocks, which led the advance in the S&P/TSX through the first half of the year, have all but erased those gains in the past three months. The two industries account for about 36 percent of the broader index.
The S&P/TSX Energy Index has pared its gain for the year to 1.6 percent while raw-materials stocks fell to a loss Oct. 7 and are now down 0.4 percent for the year.
Of the 69 members in the energy group, 63 have fallen in the second half of the year so far, led by a 48 percent plunge in Calgary-based oil explorer Lightstream Resources Ltd. (LTS)

‘Sea Change’

Crude in New York retreated 1.8 percent to settle at $85.77 a barrel yesterday, closing 20 percent below its June high to enter a bear market a day after Brent oil did the same. U.S. shale oil is set to boost U.S. crude output to the most in more than three decades, reducing demand for Canadian oil.
“You’ve got a sea change there with the U.S., and if China isn’t picking up the slack that’s creating a lot of supply that wasn’t there before,” Kinsey said.
Economic growth in China, the world’s largest commodities consumer and Canada’s second-largest trading partner after the U.S., is forecast to slow to 7 percent and 6.9 percent in 2015 and 2016, the lowest since 1990, according to the average estimate of a survey of economists by Bloomberg.
Teck Resources Ltd. (TCK/B), Canada’s largest diversified miner, has slumped 26 percent since the end of June, as iron ore prices plunged in September on new supply and tepid demand from China. Nickel fell into a bear market in London on Sept. 29.
“These things happen to commodities, they go in cycles,” Kinsey said. “It’s starting to look like it might be something that could go on for a while.”

Gold Overdone

The S&P/TSX may have already suffered the “brunt” of its losses, especially among gold producers, Youssef Zohny, a portfolio manager at Stenner Investment Partners of Richardson GMP, said. The impending end of the U.S. Federal Reserve’s monthly bond purchases this month had boosted the U.S. dollar at the expense of gold, seen as a haven investment. That trade may reverse itself as volatility returns to equity markets.
“That’s put a lot of pressure on the gold space,” Zohny said in a phone interview from Vancouver. Richardson GMP manages about C$29.3 billion. “If there is a safe haven bid and a flight out of equities, it might contribute to a rally.”
The S&P/TSX Gold Index has slumped 23 percent from a March 14 peak as gold prices tumbled 11 percent in that time, led by a 45 percent slump in Yamana Gold Inc.
To contact the reporter on this story: Eric Lam in Toronto at elam87@bloomberg.net
To contact the editors responsible for this story: Lynn Thomasson at lthomasson@bloomberg.net Jacqueline Thorpe, David Scanlan

Village Main Reef Considering Sale After Third-Party Approaches

Village Main Reef Ltd. (VIL), a South African gold producer, is considering selling its assets after receiving approaches by third parties it didn’t identify.
The company appointed Qinisele Resources (Pty) Ltd. to manage any sale process and explore alternative options for Village shareholders, the Johannesburg-based company said today in a statement. The stock rose 5.3 percent to 0.4 rand by 10:33 a.m. in Johannesburg.
“This decision has been driven by the company receiving a number of unsolicited approaches from third parties to acquire either the company or certain of its assets,” Village said. “The alternatives may include, among others, the sale of some or all of the company’s assets.”
Village’s stock has tumbled 68 percent since the start of 2013, giving it a market value of 416 million rand ($37.7 million) as gold prices dropped 27 percent. The company operates three gold mines, a platinum mine and has investments in coal and uranium operations, according to its website.
Continental Coal Ltd., in which Village bought a stake last year, received an approach from a third party interested in buying its 74 percent holding in its South African subsidiary, the West Perth, Australia-based company said in a separate statement dated Oct. 10.
To contact the reporter on this story: Kevin Crowley in Johannesburg at kcrowley1@bloomberg.net
To contact the editors responsible for this story: Will Kennedy at wkennedy3@bloomberg.net Tony Barrett, Alastair Reed.

Source : http://www.bloomberg.com

Last Posts